When we hear that the market was up or down, instinctively we think of the US stock market and the Dow.
Yet, according to the SIFMA (Securities Industry and Financial Markets Association), as of July 2025 the global fixed income markets increased to $145 trillion while global equity market capitalization increased to $126 trillion.
In this post, we will look at long- term bond trends from major nations at the top of the global bond markets. We must all remember that the history and science behind a highly leverage system of debt-based money must be understood in context of current commentary and events.
The Historical View
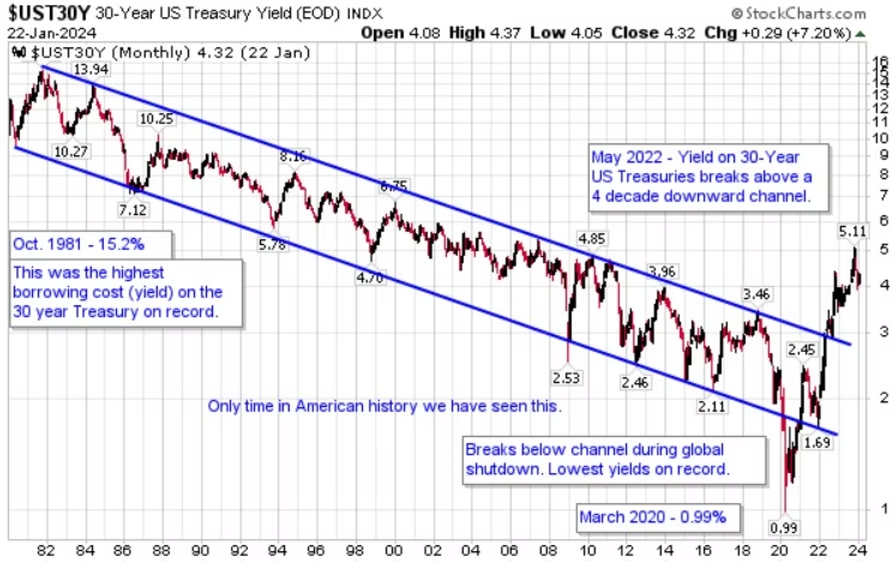
First, we will look at the 30-year US Treasury bond market. The chart below was pulled from my January 2024 Best Minds Inc blog post.
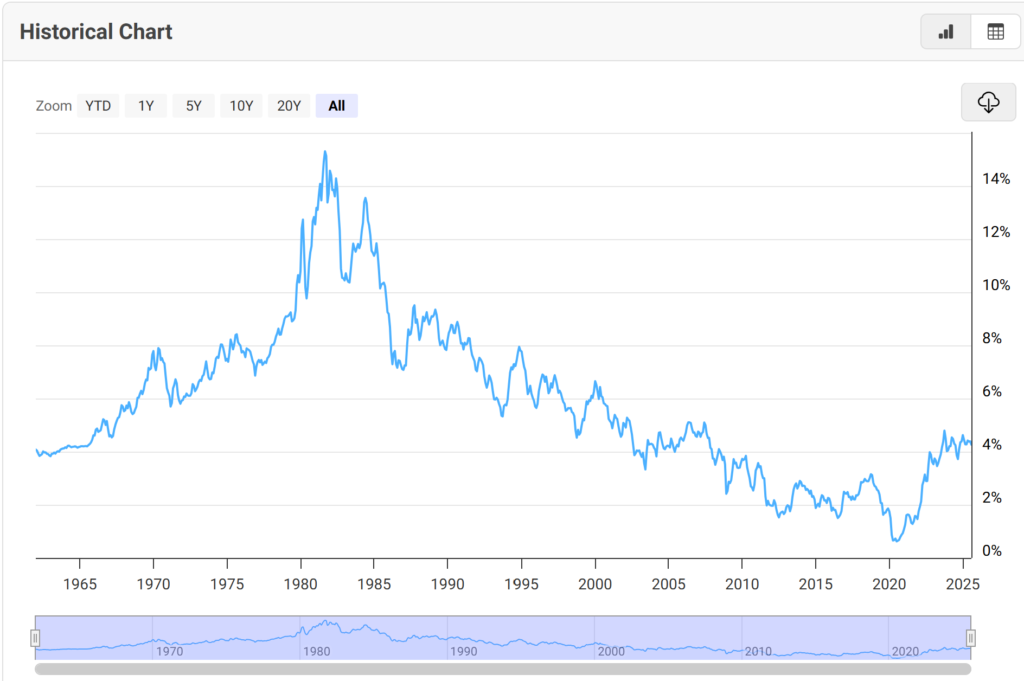
[Source: Macrotrends: 10 Year US Treasury Bond Yields, 1962-2025]
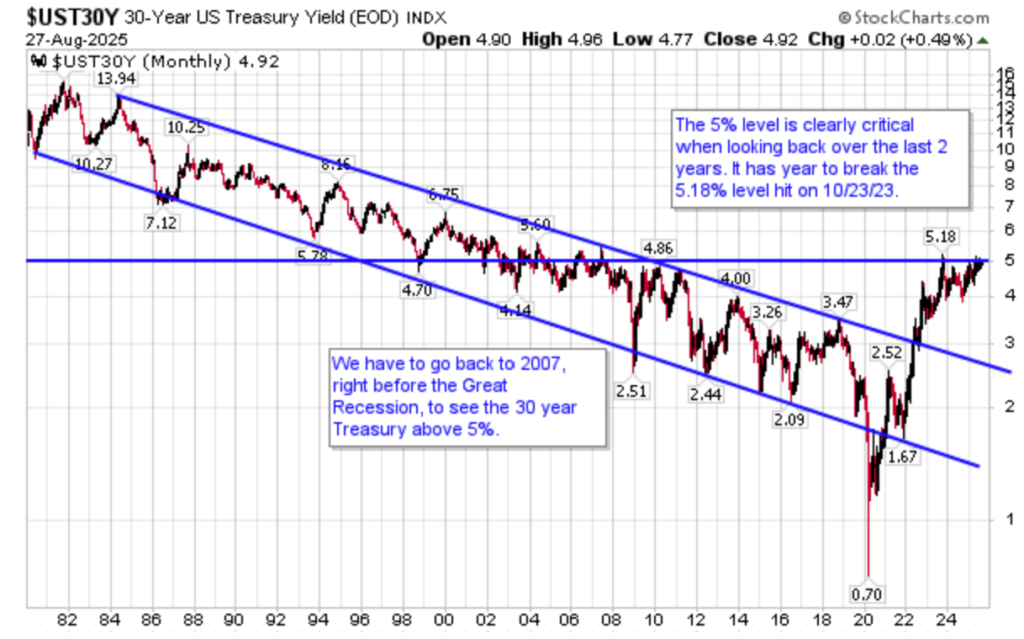
No one can look at the three charts above without seeing that the lowest yields in the U.S. 30 Year Treasury bonds took place in 2020. If you went back since the 1700s in America history, you would know that in the fall of 1981 US Treasury yields reached their highest EVER. What were you doing in 1981? I was working on my master’s degree, with no clue that a major historic event was taking place.
As yields moved lower, borrowing costs declined. This made the older bonds in this trend more valuable; holding a 10% bond became more valuable than an 8% bond and holding an 8% bond more than a 6% bond. You get the drift.
But eventually, we had to reach a historic low in what was almost a 40-year trend.
To show how extremely rare this low in 2020 was for bond yields, we will go way back in history.
So, what could ancient history teach us?
The following, in my opinion, is a quote from the best book ever assembled on bond yields and returns, A History of Interest Rates. My version is the third edition, revised (1996). The original, written by Sidney Homer with Salmon Brothers, came out in 1969. Homer starts his book with Mesopotamian Interest Rates between 3000-400 B.C. Yes, a very long time ago.
“In the Sumerian period, 3000-1900 BC, the customary rate of interest for a loan of barley was 33 1/3% per annum and for a loan of silver was 20% per annum.” [pg 29]
Humor me for another moment before we leap back closer to our time.
“One-half mina of silver, the possession of Nabu-Usabsi….is owed by Nabu-sar-ahesu…Yearly upon one mina, ten shekels of silver shall accumulate (16 2/3%). Another credit has no right of disposal over it until Nabu-Usabsi gets his money, full repaid. The men he caused to appear [4 witnesses, the priest] City of Urak, month of Ululu, 11th day of the 9th year of Nebuchadnessar, King of Babylon” [pg 29]
This loan was made in 595 BC, 9 years before Nebuchadnezzar’s army conquered Judah and took Jersualem:’
“Now when Jerusalem was captured in the ninth year of Zedekiah king of Judah, in the tenth month, Nebuchadnezzar king of Babylon and all his army came to Jerusalem and laid siege to it; in the eleventh year of Zedekiah, in the fourth month, in the ninth day of the month, the city wall was breached.” [Jeremiah 39:1-2]
No zero or negative interest rates here.
Now, back to a time closer to home, American history.
Low rates before the 21st century in America
Homer has a chart of long-term American bond yields between 1798 to 1981. During this extremely long period, the lowest annual yields were 2.53%. He also states that, “In 1946, the lowest bond yields in history were reached. Prime corporate bonds averaged a yield of as low as 2.37%; one issue of long taxable government bonds sold to yield as little as 1.93%”. [bold mine]
I am taking us back through HISTORY to point out something you may have never heard or read. What we saw around the world in the last decade were THE lowest yields ever.
Anyone understanding the HISTORY of bonds and loans spanning centuries and millennia, understands the total insanity of central banks a few years ago talking about negative interest rates and tools as though these “leaders of finance” could stop the eventual RISE in yields and DECLINE in bond values. Market trends, like life on this old planet, never go on forever.
Japan: Let’s Buy Our Way Out
If you asked anyone from any culture, “Is there such a thing as unlimited debt without consequences?”, they would say NO. If you asked them about the “unlimited debt” concept from the central banks around the world, they would probably dismiss the question and end the conversation.
In April of 2013, the Bank of Japan began buying large amounts of their own bonds as part of their “monetary easing” policy. At the time, the BOJ owned 11.5% of all Japanese government bonds. By the end of 2022, they owned just over HALF of their government’s bonds, an increase of more than 4-fold in one decade. The wizards of central banking in Japan managed to sell the idea of “negative rates” for a short period of time by telling banks and consumers to BORROW more money as a way everyone would stimulate the economy, while banks and savers HOLDING higher reserves for safety were punished. It was an experiment in changing human behavior. To tell people in debt, “Take on more debt and go spend more, we will lower your rates”, while telling those with savings and more frugal, “you will be punished for being prudent”, was a policy doomed to fail.
[It’s Official: The BOJ now owns more than half of Japan’s bonds, The Asahi Shimbun, Dec 19, ‘22]
The Bank of Japan (BOJ) ended eight years of negative interest rates and other remnants of its unorthodox policy on Tuesday, making a historic shift away from its focus on reflating growth with decades of massive monetary stimulus.
While the move was Japan’s first-interest rate hike in 17 years, it still keeps rates stuck around zero as a fragile economic recovery forces the central bank to go slow on further rises in borrowing costs, analysts say. [Bank of Japan scraps radical policy, makes first rate hike in 17 years, Reuters, March 19 ‘24]
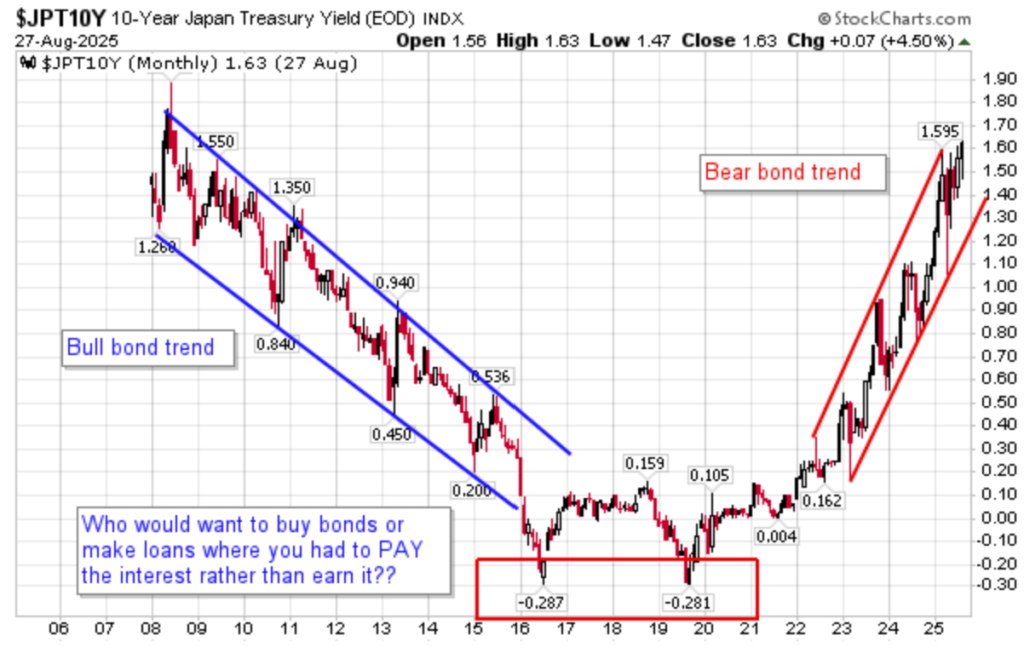
As we can see from the chart above, the Bank of Japan is not getting bond yields to stay low, they have been rising since the trend went negative.
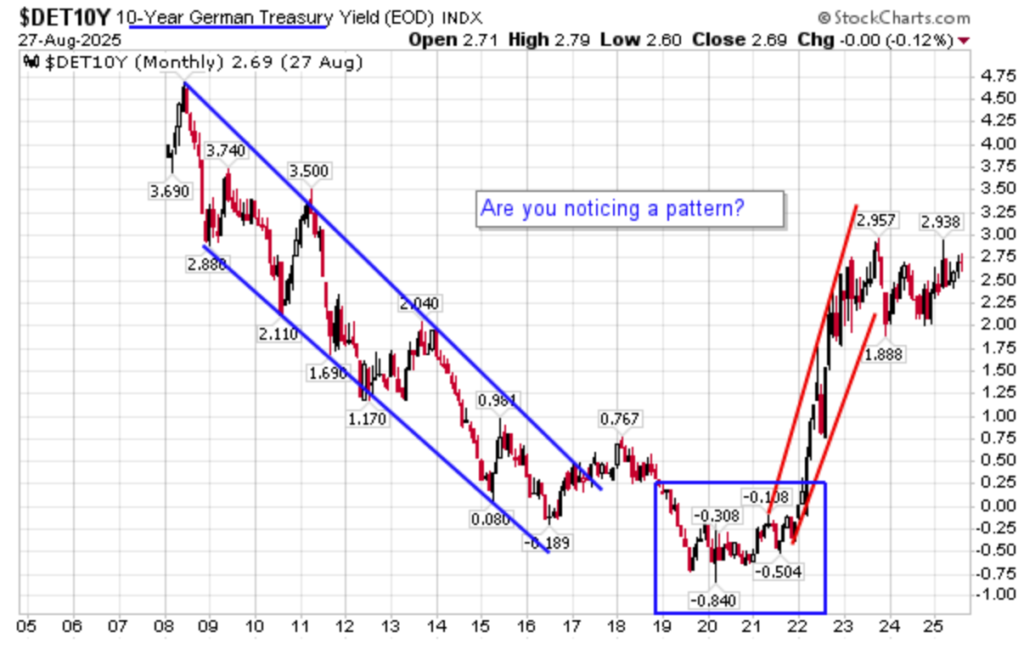
But, as we can see from German government bonds, they are not able to control the yields on their bonds either. Global markets are doing that.
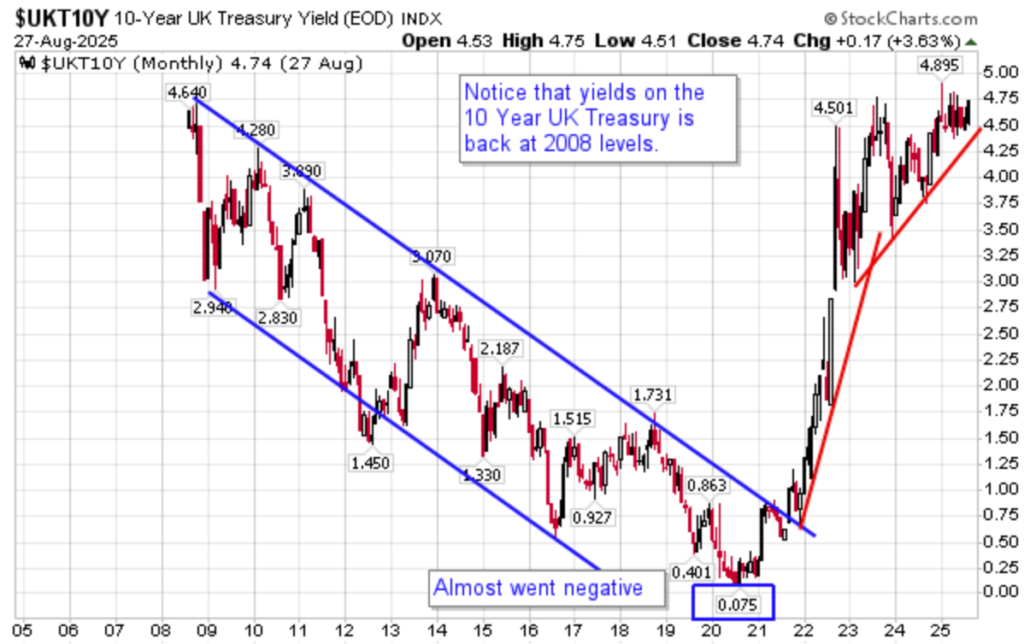
And “The City”, the financial center of London since the Bank of England was formed in 1694, is proving their long history in central banking is not helping them as UK 10-year yields have already risen above 2008 yields.
Throughout history, the City grew as an economic powerhouse, with merchants, traders, and bankers establishing their presence. The Bank of England was founded here in 1694, solidifying the City’s role as a hub for finance. Over time, the City’s distinct governance model and commercial environment allowed it to grow into one of the most important financial centers in the world. [The City of London: A Unique Financial Hub and Historic Enclave, Faisal Khan, Oct.17 ‘24]
Conclusion: Fed Rate Seems Certain, Sept 17
With another rate cut by the Federal Reserve on September 17 almost certain, will real world borrowing costs descend?
September Rate Cut No Longer a Conclusion, Statista, Aug 19 ‘25
Powell Signals Likely Rate Cut in Jackson Hole Speech – Igniting Stock Rally, Forbes, Aug 22, ‘25
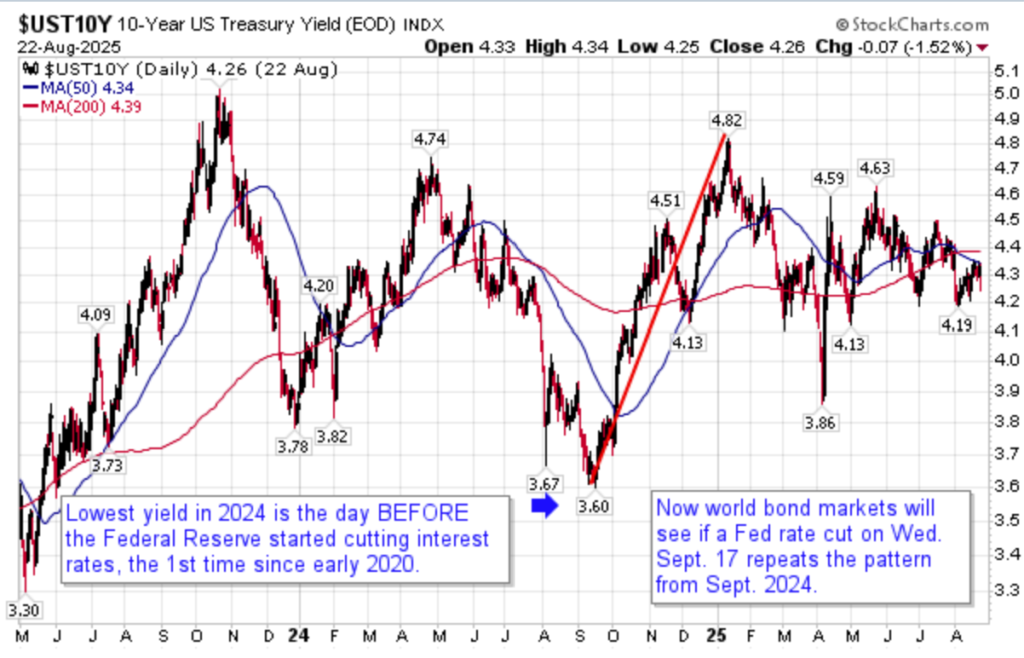
In the fall of 2024 when the Federal Reserve cut the Fed Funds Rate three times. As we can see, the yields on 10 Year US Treasuries did just the opposite.
Will the Dow climb higher towards 50,000, or will the 45,000-46,000 range give way to the downside, leaving these all-time high levels?
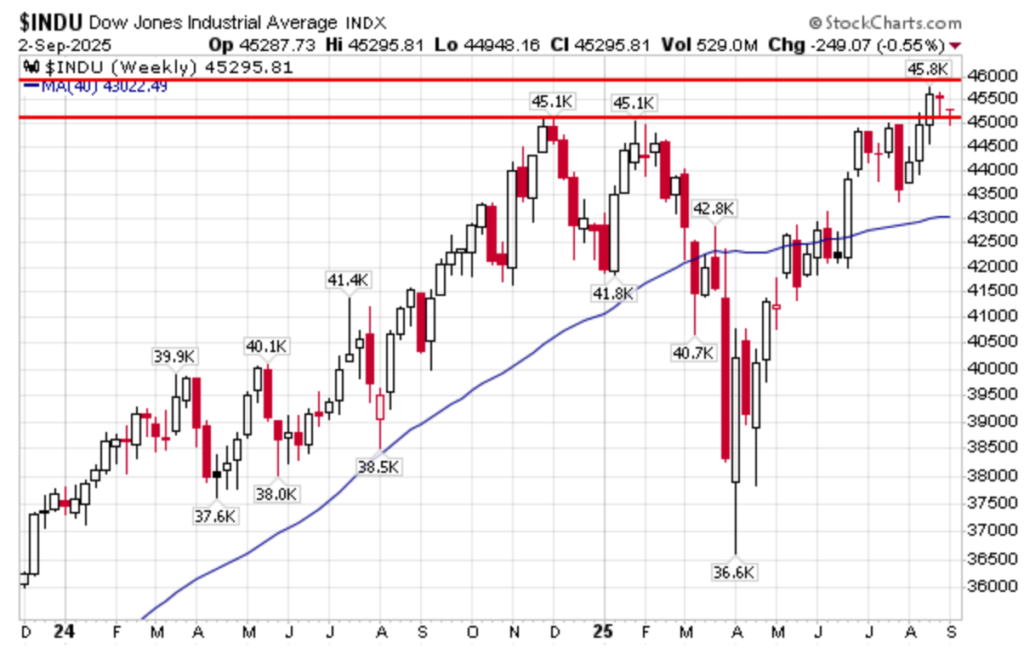
The one thing that history has already shown us in the last decade is that we have already seen the lowest yields in history. Bull and bear market trends are common throughout the history of all markets. Pretending that with enough market manipulation we can have an eternal stock rally and return to the lowest yields in history appears to me extremely unlikely and almost a “religious” devotion to the modern day “money making wizards”.
As I wrap up this post, I am reminded of a post in late 2018 by John Rubio who started the website, Dollar Collapse. At that time, Rubio stated in an article that all the major equity indices in the US – Dow 30, NASDAQ 100, and S&P 500 – had reached their longest bull markets on record. We are now 7 years past those records.
I found this chart on their website in an article by Graham Summers, another name with a long history in writing market commentary. “Put another way, the era of ever cheaper debt is OVER. For the first time in 45 years, it is costing the U.S. MORE to issue new debt
(or roll over old debt).[Bold text is the author’s] [The Single Most Important Chart in the World is Flashing “Danger”, Graham Summers, Sept 1, 2025]
We continue to watch…and watch closely. Be on alert my friends.
“Do not lay up for yourselves treasures on earth, where moth and rust destroy and where thieves break in and steal, but lay up for yourselves treasures in heaven, where neither moth nor rust destroys and where thieves do not break in and steal. For where your treasure is, there your heart will be also.” Matthew 6:19-21
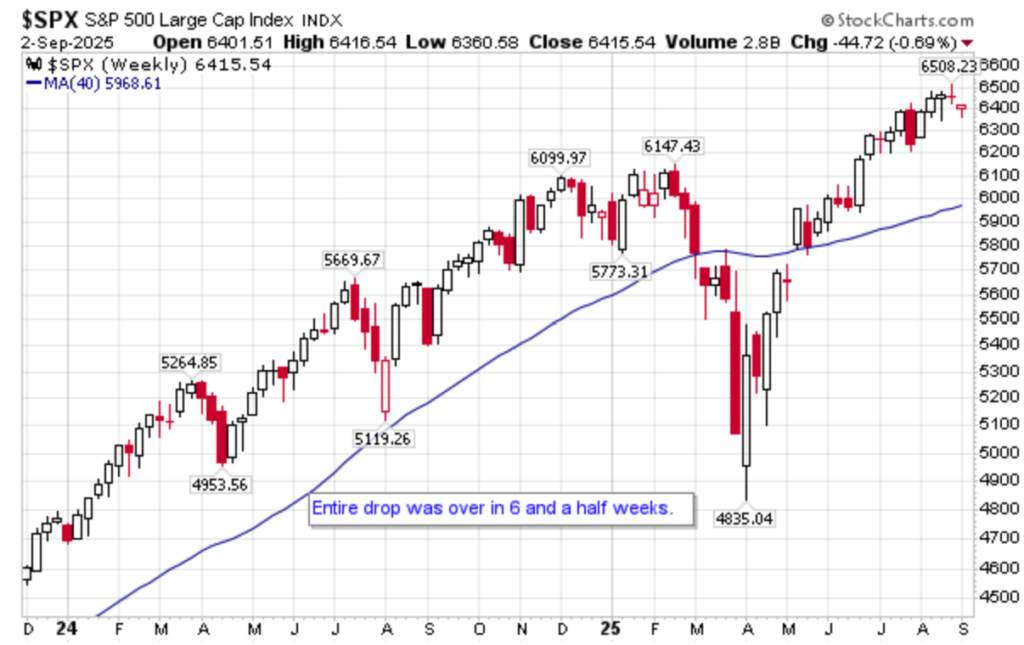
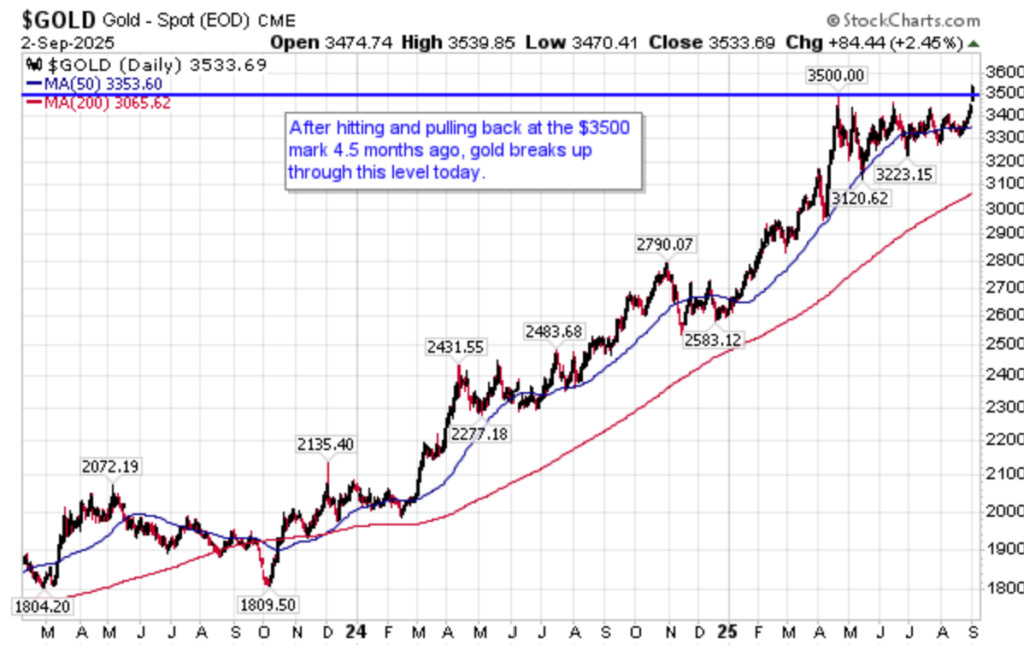
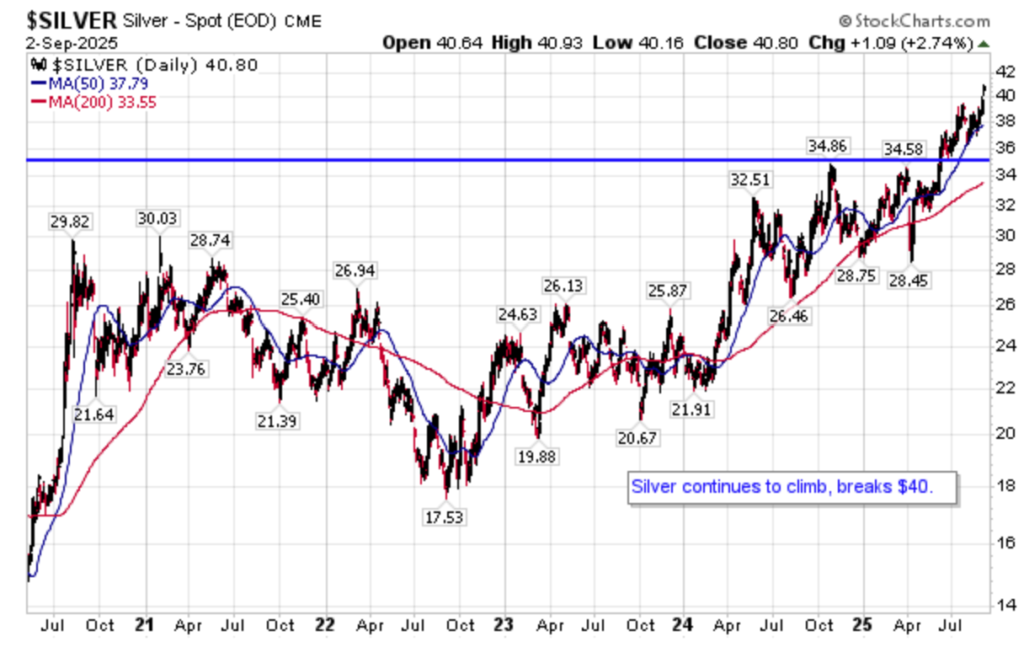
Extra: Sept 2 – Gold and Silver break out about $3500 and $40 respectively.
